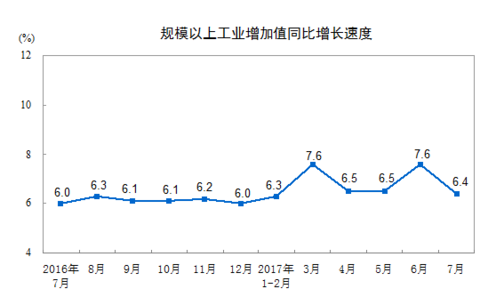
In July 2017, the added value of industrial enterprises above designated size increased by 6.4% year-on-year (the growth rate of the added value is the actual growth rate after deducting the price factor), which is 1.2 percentage points lower than that in June and 0.4 percentage points higher than the same month of the previous year. In terms of the chain, in July, the added value of industrial enterprises above designated size increased by 0.41% from the previous month. From January to July, the added value of industrial enterprises above designated size increased by 6.8% year-on-year.
In three categories, in July, the added value of the mining industry fell by 1.3% year-on-year, the manufacturing industry grew by 6.7%, and the electricity, heat, gas and water production and supply industries grew by 9.8%.
In terms of economic types, in July, the value-added of state-owned holding companies increased by 6.7% year-on-year; collective enterprises fell by 3.6%, joint-stock enterprises increased by 6.7%, and foreign-invested enterprises from Hong Kong, Macao and Taiwan increased by 6.7%.
In terms of industries, in July, 37 of the 41 major industries maintained an increase in value added. Among them, the agricultural and sideline food processing industry increased by 6.0%, the textile industry increased by 4.3%, the chemical raw materials and chemical products manufacturing industry increased by 2.3%, the non-metallic mineral products industry increased by 3.4%, the ferrous metal smelting and rolling processing industry increased by 2.1%, non-ferrous metals. Smelting and rolling processing industry increased by 1.1%, general equipment manufacturing industry increased by 11.5%, special equipment manufacturing industry increased by 11.9%, automobile manufacturing industry increased by 11.8%, railway, shipbuilding, aerospace and other transportation equipment manufacturing increased by 3.3%, electrical machinery The equipment manufacturing industry grew by 11.7%, the computer, communications and other electronic equipment manufacturing industries grew by 11.8%, and the power, heat production and supply industries grew by 9.7%.
In terms of regions, in July, the added value of the eastern region increased by 6.4% year-on-year, the central region increased by 7.9%, the western region increased by 5.9%, and the northeast region increased by 0.6%.
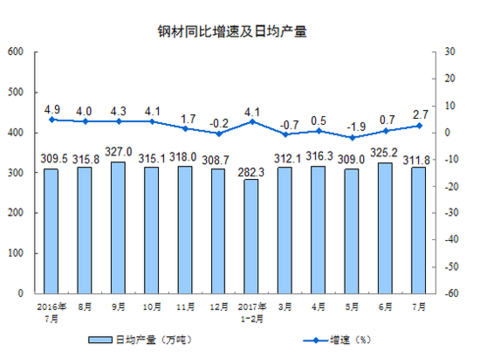
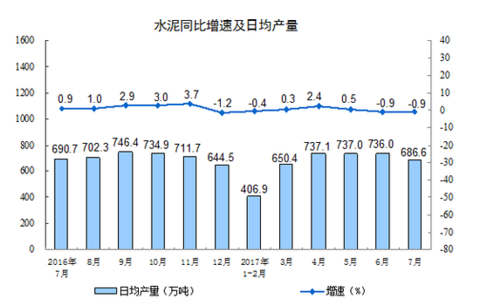
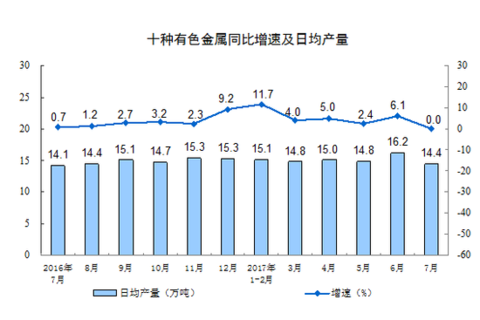
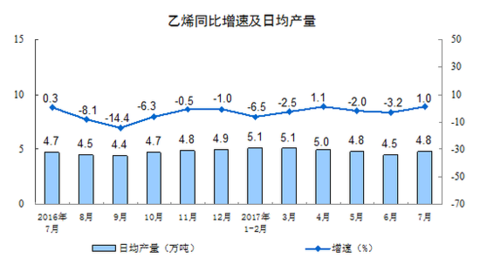
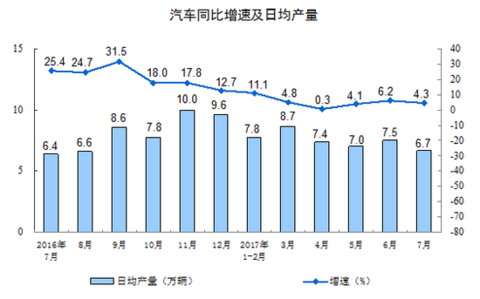
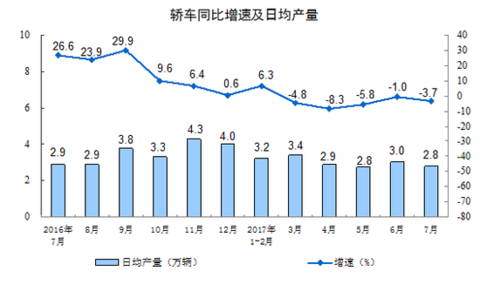
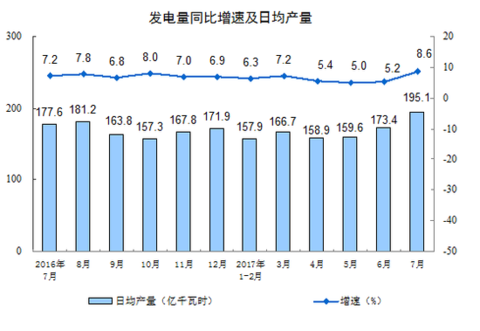
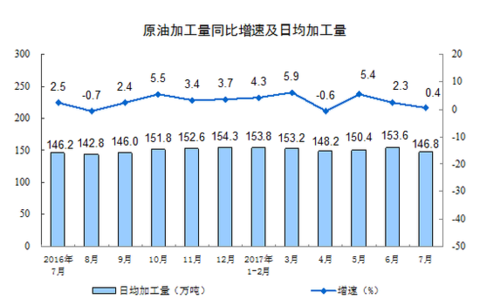
In terms of products, in July, 398 of the 596 products increased year-on-year. Among them, steel 97.67 million tons, an increase of 2.7%; cement 211.83 million tons, down 0.9%; ten kinds of non-ferrous metals 4.47 million tons, unchanged year-on-year; ethylene 1.48 million tons, an increase of 1.0%; automobiles of 2.073 million, an increase of 4.3%; Cars were 866,000, down 3.7%; power generation was 604.7 billion kwh, up 8.6%; crude oil processing was 45.5 million tons, up 0.4%.
In July, the sales rate of industrial enterprises was 97.9%, an increase of 0.3 percentage points over the same period of the previous year. The export value of industrial enterprises reached 106.21 billion yuan, a nominal increase of 8.6% year-on-year.
Main data of industrial production above designated size in July 2017 | ||||
July | January-July | |||
Absolute quantity | Year-on-year growth | Absolute quantity | Year-on-year growth | |
I. Increase in industrial value above designated size | 6.4 | 6.8 | ||
Divided into three categories | ||||
mining industry | -1.3 | -1.0 | ||
manufacturing | 6.7 | 7.3 | ||
Electricity, heat, gas and water production and supply | 9.8 | 8.3 | ||
Economic type | ||||
Of which: state-owned holding companies | 6.7 | 6.3 | ||
Of which: collective enterprises | -3.6 | 1.1 | ||
Joint-stock company | 6.7 | 7.0 | ||
Foreign businessmen, Hong Kong, Macao and Taiwanese investment companies | 6.7 | 6.7 | ||
Major industry added value | ||||
Agricultural and sideline food processing industry | 6.0 | 7.1 | ||
Food manufacturing | 7.2 | 8.7 | ||
Textile industry | 4.3 | 4.5 | ||
Chemical raw materials and chemical manufacturing | 2.3 | 4.0 | ||
Pharmaceutical manufacturing | 11.3 | 11.6 | ||
Rubber and plastic products industry | 4.4 | 6.8 | ||
Non-metallic mineral products industry | 3.4 | 5.2 | ||
Ferrous metal smelting and rolling processing industry | 2.1 | 0.7 | ||
Non-ferrous metal smelting and rolling processing industry | 1.1 | 2.0 | ||
Metal products industry | 5.4 | 7.9 | ||
General equipment manufacturing | 11.5 | 11.2 | ||
Special equipment manufacturing | 11.9 | 12.1 | ||
Automotive Manufacturing | 11.8 | 13.0 | ||
Railway, marine, aerospace and other transportation equipment manufacturing | 3.3 | 5.1 | ||
Electrical machinery and equipment manufacturing | 11.7 | 10.0 | ||
Computer, communications and other electronic equipment manufacturing | 11.8 | 13.6 | ||
Electricity, heat production and supply | 9.7 | 8.3 | ||
Main product output | ||||
Cloth (100 million meters) | 63 | 2.8 | 412 | 4.7 |
Sulfuric acid (100% off) (10,000 tons) | 732 | 2.1 | 5319 | 4.0 |
Caustic soda (100% off) (10,000 tons) | 281 | 0.7 | 2030 | 4.5 |
Ethylene (10,000 tons) | 148 | 1.0 | 1045 | -2.6 |
Chemical fiber (10,000 tons) | 449 | 4.2 | 3008 | 4.3 |
Cement (10,000 tons) | 21283 | -0.9 | 132612 | 0.2 |
Flat glass (10,000 weight box) | 6662 | 3.2 | 47902 | 4.6 |
Pig iron (ten thousand tons) | 6207 | 5.1 | 42420 | 3.5 |
Crude steel (10,000 tons) | 7402 | 10.3 | 49155 | 5.1 |
Steel (10,000 tons) | 9667 | 2.7 | 64856 | 1.1 |
Ten non-ferrous metals (10,000 tons) | 447 | 0.0 | 3201 | 6.0 |
Of which: primary aluminum (electrolytic aluminum) (10,000 tons) | 269 | -0.3 | 1953 | 7.5 |
Metal cutting machine tool (10,000 units) | 6 | 6.8 | 42 | 5.2 |
Industrial robot (set / set) | 12458 | 90.4 | 71631 | 57.0 |
Car (10,000 cars) | 207.3 | 4.3 | 1604.1 | 6.0 |
Of which: car (10,000 cars) | 86.6 | -3.7 | 641.8 | -1.7 |
Sporty multi-purpose passenger vehicle (SUV) (10,000 units) | 66.6 | 12.1 | 527.9 | 18.6 |
Of which: new energy vehicles (10,000 vehicles) | 5.5 | 48.6 | 26 | 19.8 |
Generator set (power generation equipment) (10,000 kW) | 895 | -16.8 | 7427 | -0.5 |
Microcomputer equipment (10,000 units) | 2505 | 23.2 | 16677 | 7.3 |
Mobile communication handset (10,000 units) | 16357 | 0.9 | 110082 | 4.0 |
Of which: smart phones (10,000 units) | 12509 | 3.5 | 82075 | 3.4 |
Integrated circuit (100 million pieces) | 133 | 17.7 | 878 | 23.7 |
Raw coal (10,000 tons) | 29438 | 8.5 | 200606 | 5.4 |
Coke (ten thousand tons) | 3728 | 0.1 | 25843 | 2.2 |
Crude oil (10,000 tons) | 1625 | -2.9 | 11279 | -4.8 |
Crude oil processing capacity (10,000 tons) | 4550 | 0.4 | 32071 | 2.9 |
Natural gas (100 million cubic meters) | 117 | 14.7 | 858 | 8.8 |
Power generation (100 million kWh) | 6047 | 8.6 | 35698 | 6.8 |
Thermal power generation (100 million kWh) | 4334 | 10.5 | 26581 | 7.8 |
Hydropower generation (100 million kWh) | 1246 | 0.2 | 5857 | -3.4 |
Nuclear power generation (100 million kWh) | 231 | 16.5 | 1385 | 19.1 |
Wind power generation (100 million kWh) | 180 | 11.6 | 1522 | 18.0 |
Solar power generation (100 million kWh) | 56 | 26.7 | 352 | 36.3 |
Product sales rate (%) | 97.9 | 0.3 (% point) | 97.5 | 0.1 (% point) |
Export delivery value (100 million yuan) | 10621 | 8.6 | 71672 | 10.5 |
Note
1. Explanation of indicators
The growth rate of industrial added value: that is, the rate of industrial growth, is an indicator used to reflect the degree of change in the amount of industrial production in a given period of time. Using this indicator, we can judge the running trend of the short-term industrial economy and judge the economic prosperity. It is also an important reference and basis for formulating and adjusting economic policies and implementing macroeconomic regulation.
Product sales rate: is the ratio of sales value to total industrial output value, which is used to reflect the production and sales of industrial products.
Export delivery value: refers to the value of products exported by industrial enterprises (including entrusted) (including sales to Hong Kong, Macao, Taiwan) or to foreign trade departments, as well as foreign samples, processing of incoming materials, assembly of parts and compensation. The value of products produced by trade.
Daily average product output: Calculated by dividing the total output of industrial enterprises above designated size by the calendar month of the month.
Due to the annual changes in the scope of industrial enterprises above designated size, in order to ensure that the data for this year is comparable with that of the previous year, the number of simultaneous use of various indicators such as the calculation of product output growth rate is consistent with the statistical scope of the current period, and published in the previous year. There is a difference in the caliber of the data.
2. Statistical range
The statistical scope of industrial enterprises above designated size is industrial enterprises with annual income of 20 million yuan or more.
3. Survey method
Industrial production reports for industrial enterprises above designated size are fully surveyed on a monthly basis (January data exemption).
4. Division of East, Central, Western and Northeastern Regions
The eastern region includes 10 provinces (cities) including Beijing, Tianjin, Hebei, Shanghai, Jiangsu, Zhejiang, Fujian, Shandong, Guangdong, and Hainan; the central region includes six provinces including Shanxi, Anhui, Jiangxi, Henan, Hubei, and Hunan; Inner Mongolia, Guangxi, Chongqing, Sichuan, Guizhou, Yunnan, Tibet, Shaanxi, Gansu, Qinghai, Ningxia, Xinjiang 12 provinces (municipalities and autonomous regions); Northeast China includes Liaoning, Jilin, Heilongjiang provinces.
5, industry classification standards
Implementation of the national economic industry classification standard (GB/T 4754-2011), please refer to http://
6, the ring data revision
According to the seasonal adjustment model, the results of the automatic correction are revised, and the growth rate of industrial added value above designated size from July 2016 to June 2017 is revised. The revised results and the July 2017 ring data are as follows:
month | Ring growth rate (%) | |
2016 | July | 0.51 |
August | 0.53 | |
September | 0.46 | |
October | 0.50 | |
November | 0.55 | |
December | 0.50 | |
2017 | January | 0.57 |
February | 0.59 | |
March | 0.80 | |
April | 0.55 | |
May | 0.51 | |
June | 0.79 | |
July | 0.41 |
The color matching of children's clothing is not fixed. Excessive stylization will make it look dull and lifeless, but there are too many changes and it is easy to appear messy.The baby's outfit is actually very simple. For Girls, a fashionable denim skirt is perfect. The thickness is moderate, allowing children to play without restraint.
Boys Peacoat,Kid'S Parkas Jacket,Baby Boy Peacoat With Hood,Winter Peacoat
Dongguan Yumuran Garment Co.Ltd , https://www.1movingkidsjacketes.com